
Stop Managing in the Rearview Mirror: How to Predict Problems Before They Happen
Introduction: The Rearview Mirror Problem
Are your team meetings spent discussing why you missed last week's targets? Do you feel like you're constantly "firefighting"—reacting to performance issues only after they've already occurred? This reactive loop burns out your best people, inflates costs, and erodes customer trust. It’s like trying to drive a car by only looking in the rearview mirror. You can see where you've been, but you have no idea what's coming up ahead.
Many teams operate this way, relying entirely on "rearview mirror" data like weekly outputreports or monthly quality scores. These metrics, known as lagging indicators, are great for understanding past performance, but they arrive too late to change the outcome. By the time you get the report, the opportunity to influence the results is gone.
This article introduces a more powerful, forward-looking approach to performance management. By balancing these traditional lagging indicators with leading indicators—real-time metrics that act as early warning signals—you can shift from being a reactive manager to a proactive leader who influences outcomes before they are set in stone.
Stop Driving Blind—Understand the Difference Between Your Dashboard and Your Windshield
To gain a complete view of performance, you need to understand the two types of metrics that guide your business. Think of lagging indicators as your dashboard—they tell you how far you've gone and how much fuel you've used. Leading indicators are your windshield—they show you the road ahead.
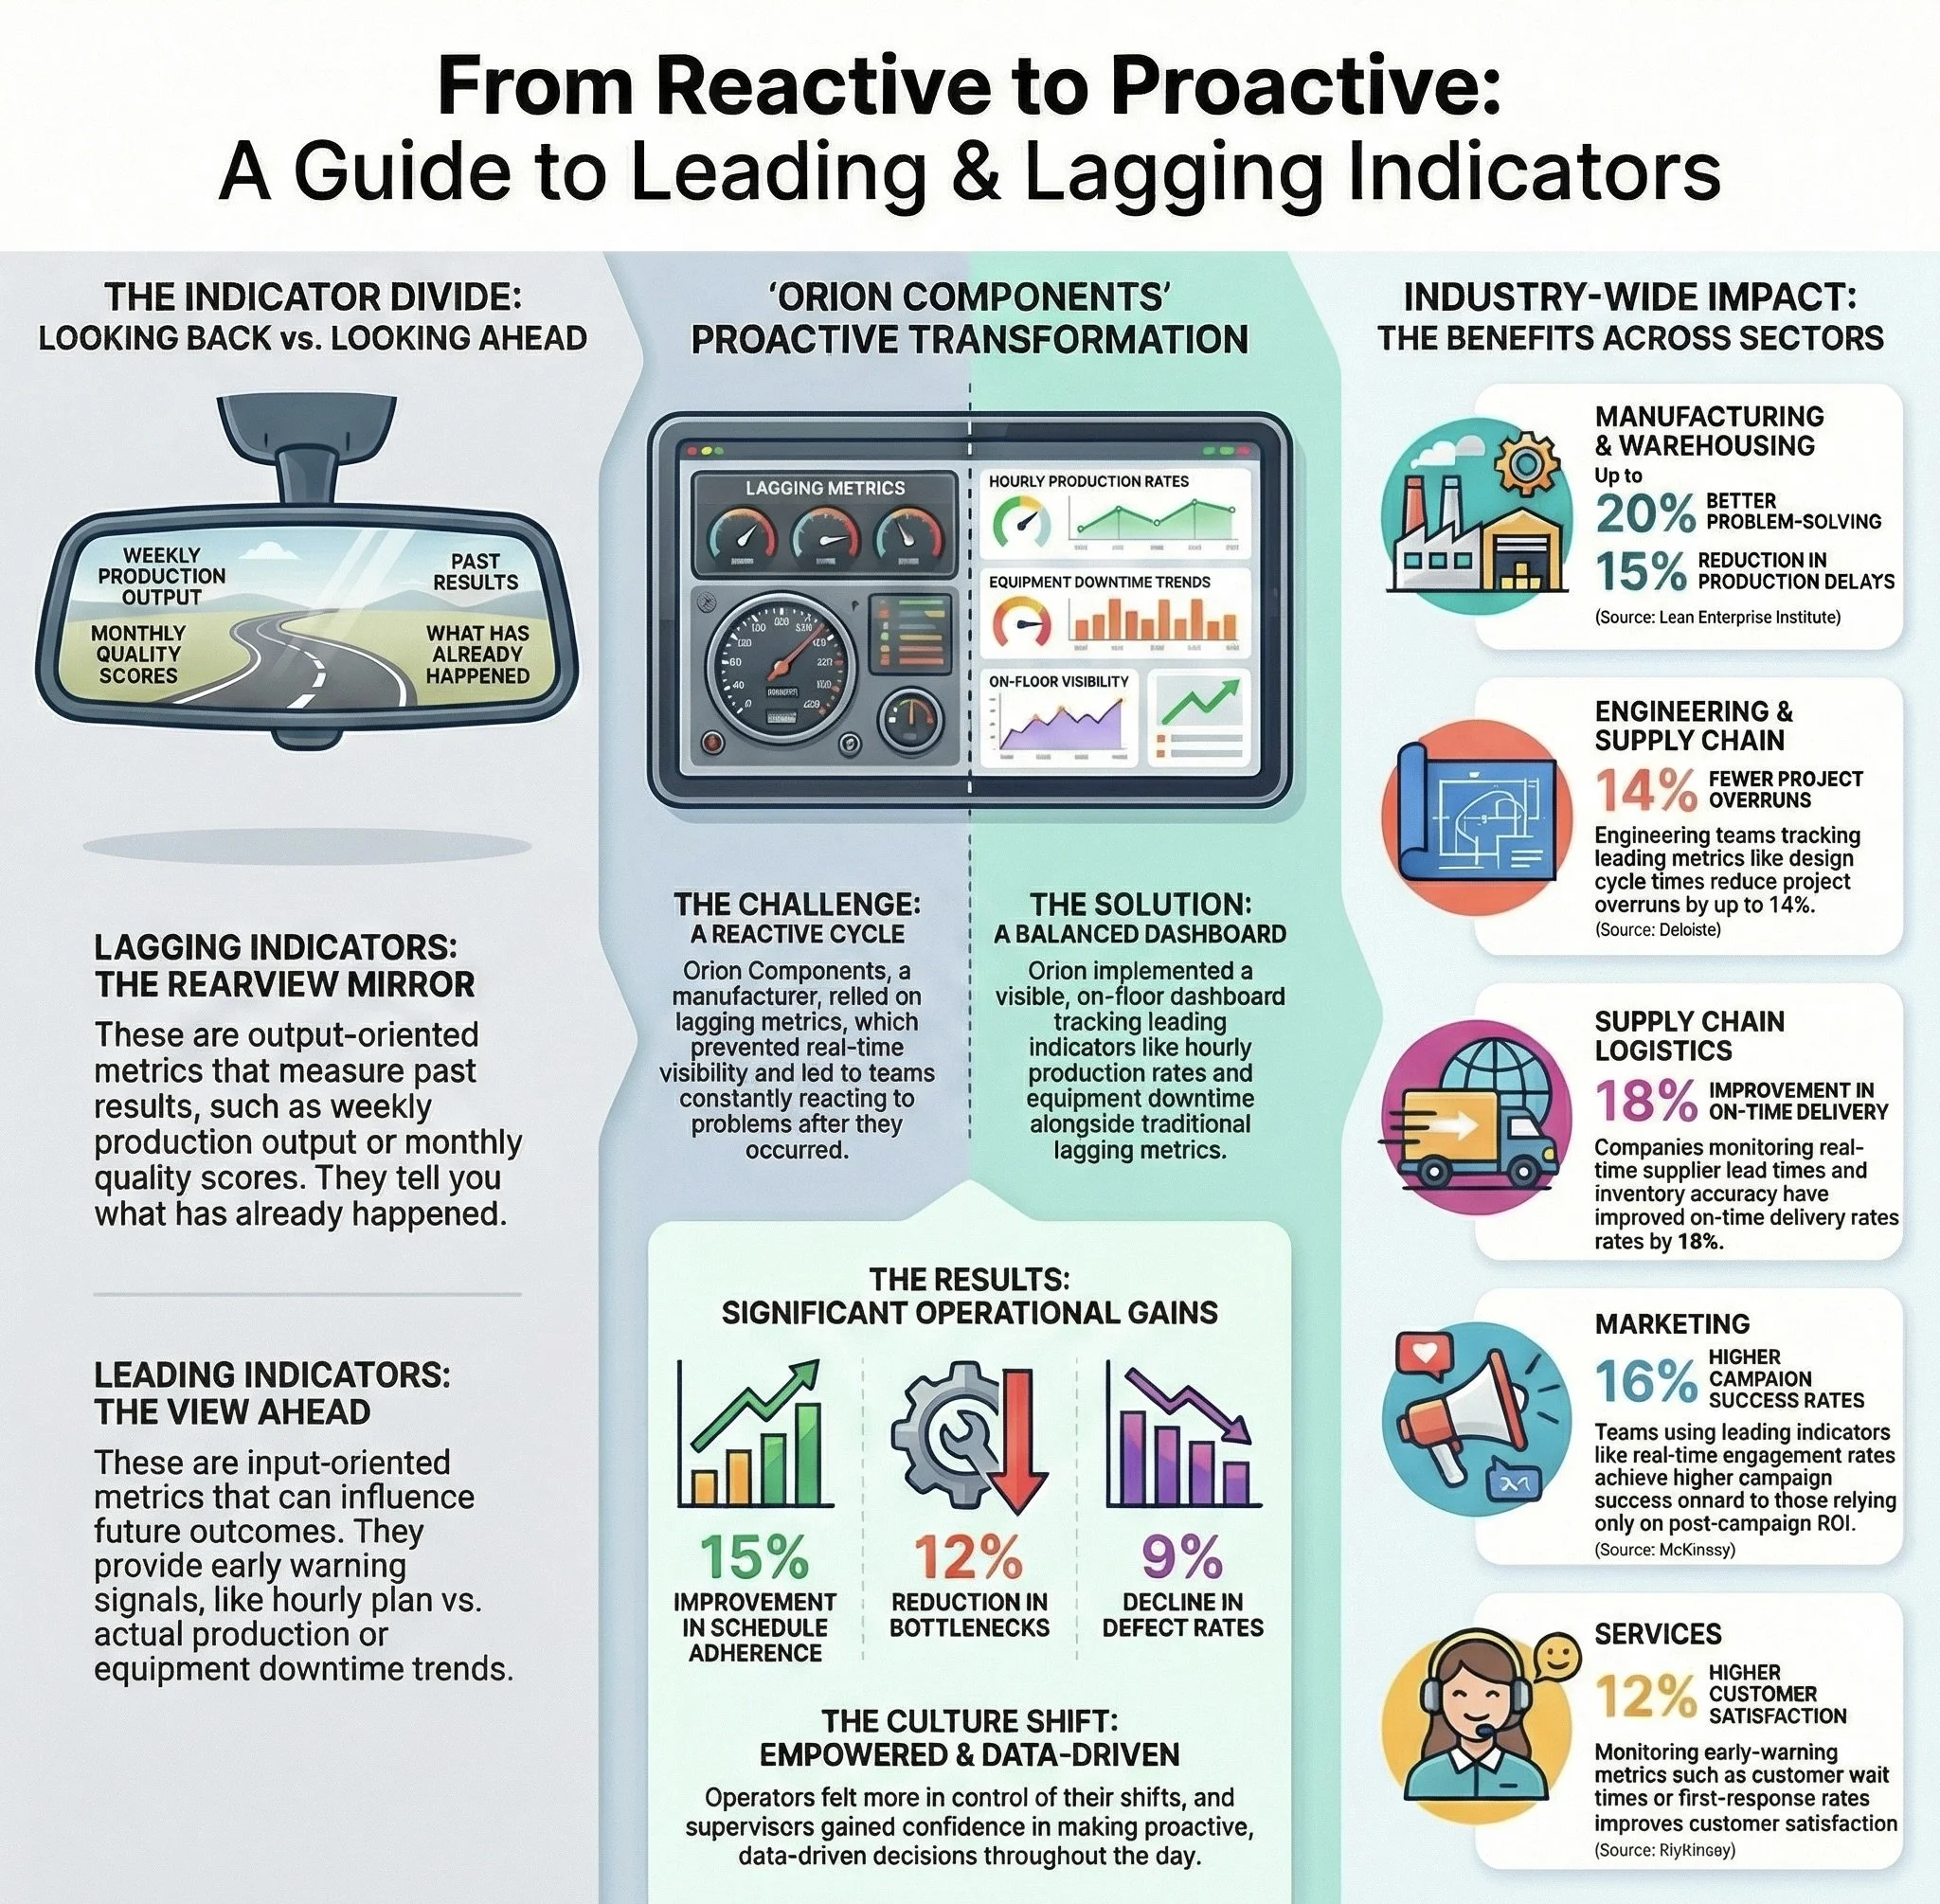
• Lagging Indicators (The Dashboard): Output-focused metrics that measure past results. They confirm if you achieved a desired outcome but arrive too late to influence it.
◦ Examples: Weekly production output, monthly quality scores, monthly defect rates.
• Leading Indicators (The Windshield): Input-focused metrics that predict future results. They are real-time, actionable signals that allow you to make adjustments before an outcome is final.
◦ Examples: Hourly plan vs. actual, equipment downtime trends, the frequency of operator interventions.
True operational mastery isn't about abandoning lagging indicators; historical reporting is still valuable for long-term trend analysis. The goal is to balance them with leading indicators to get a complete, real-time picture of performance, allowing you to see both where you've been and where you're going.
How One Manufacturer Cut Bottlenecks by 12% by Changing How They Looked at Data
Orion Components, a manufacturer of electrical enclosures and assemblies, was stuck in a reactive cycle. Their reliance on lagging indicators meant they were constantly behind, responding to problems instead of preventing them.
The company's performance was assessed using metrics like weekly production output and monthly defect rates. While useful for reports, this data failed to provide the real-time visibility needed to prevent issues from impacting customer orders. Teams were frequently reacting to missed targets after the fact, a strategy that led directly to costly overtime and customer dissatisfaction.
To break this cycle, Orion implemented a balanced approach. They started tracking leading indicators like hourly plan vs. actual production rates, equipment downtime trends, and the frequency of operator interventions. These metrics were displayed on a production floor dashboard and reviewed in daily huddles, enabling supervisors and frontline teams to identify deviations as they happened and adjust workflows to stay on track.
The results were transformative. Within three months, Orion achieved a 15% improvement in schedule adherence, a 12% reduction in production bottlenecks, and a 9% decline in quality defect rates. By monitoring leading indicators, teams could take corrective action early, preventing minor issues from becoming major problems and shifting from reactive firefighting to proactive performance management.
This Strategy Isn't Just for the Factory Floor
This strategic pivot from hindsight to foresight is not confined to the factory floor; it is a competitive differentiator across industries. The data highlights a clear pattern: organizations that use real-time data to influence results gain a distinct competitive advantage.
• Manufacturing, Warehousing, and Supply Chain: According to the Lean Enterprise Institute, organizations using this approach see a 20% improvement in proactive problem-solving and a 15% reduction in production delays.
• Engineering and Supply Chain: A Deloitte study shows that tracking leading indicators can reduce project overruns by up to 14% and improve on-time delivery rates by 18%.
• Marketing and Services: Research from McKinsey found that marketing teams can achieve 16% higher campaign success rates, and service organizations can improve customer satisfaction scores by 12% by monitoring leading metrics.
These statistics underscore the universal value of this balanced approach. Whether managing a production line, an engineering project, or a marketing campaign, using real-time data to make forward-looking decisions is key to achieving better outcomes.
The Real Prize Is an Empowered and Agile Team Culture
The benefits of balancing leading and lagging indicators go beyond operational numbers; they create a profound cultural shift. When teams are equipped with real-time data, their relationship with their work changes from passive reporting to active ownership.
At Orion Components, this cultural transformation was as notable as the productivity gains. Operators and team leaders reported feeling more in control of their shifts, armed with the data they needed to influence outcomes directly. Supervisors gained confidence in making data-driven decisions throughout the day. Critically, leadership saw improved alignment between short-term actions and long-term business goals, bridging the gap between frontline activity and strategic objectives.
This method fosters a culture of proactive management and accountability. It empowers teams at every level to take ownership of their performance, turning them into active drivers of their own success.
What Does Your Future Look Like?
In today's competitive landscape, the shift from reactive manager to proactive influencer is a fundamental requirement for survival and market leadership. Relying solely on lagging indicators is choosing to be a historian of your own failures. The choice is stark: lead your industry by looking forward or become irrelevant by managing in the past. By balancing historical data with predictive leading indicators, you give your team both the dashboard and the windshield needed to navigate challenges and seize opportunities.
This approach transforms your organization from one that reports on what happened to one that makes things happen. It fosters agility, empowers your teams, and drives sustained improvement.
What is one leading indicator you could start tracking tomorrow to change your team's future?