
The End of Analysis Paralysis: Why Your Next Big Win is on a Color-Coded Whiteboard
In today's business environment, we are drowning in data. Teams are armed with endless spreadsheets and complex dashboards, yet this firehose of information often leads to “analysis paralysis.” By the time we decipher the data and agree on a decision, the opportunity to make a real impact has passed. This constant cycle of reactive firefighting results in missed targets, persistent bottlenecks, and exhausted teams.
What if the solution wasn't more data, but radical clarity? Enter visual management, a surprisingly powerful practice that serves as an essential antidote to information overload. By using clear, intuitive visual cues like color-coding and simple symbols, teams can understand performance at a glance, enabling them to make faster, more confident decisions directly on the front line.
This article explores a few counter-intuitive and impactful takeaways about how this practice is changing the way we work. Moving far beyond its factory-floor roots, visual management has become a critical competitive advantage for any team looking to unlock speed, engagement, and a proactive culture.
1. It’s Spreading Far Beyond the Production Line.
While visual management began in manufacturing, its core principles—simplicity, clarity, and speed—are universally applicable. Today, organizations across diverse sectors are successfully adopting these tools to drive performance and eliminate complexity.
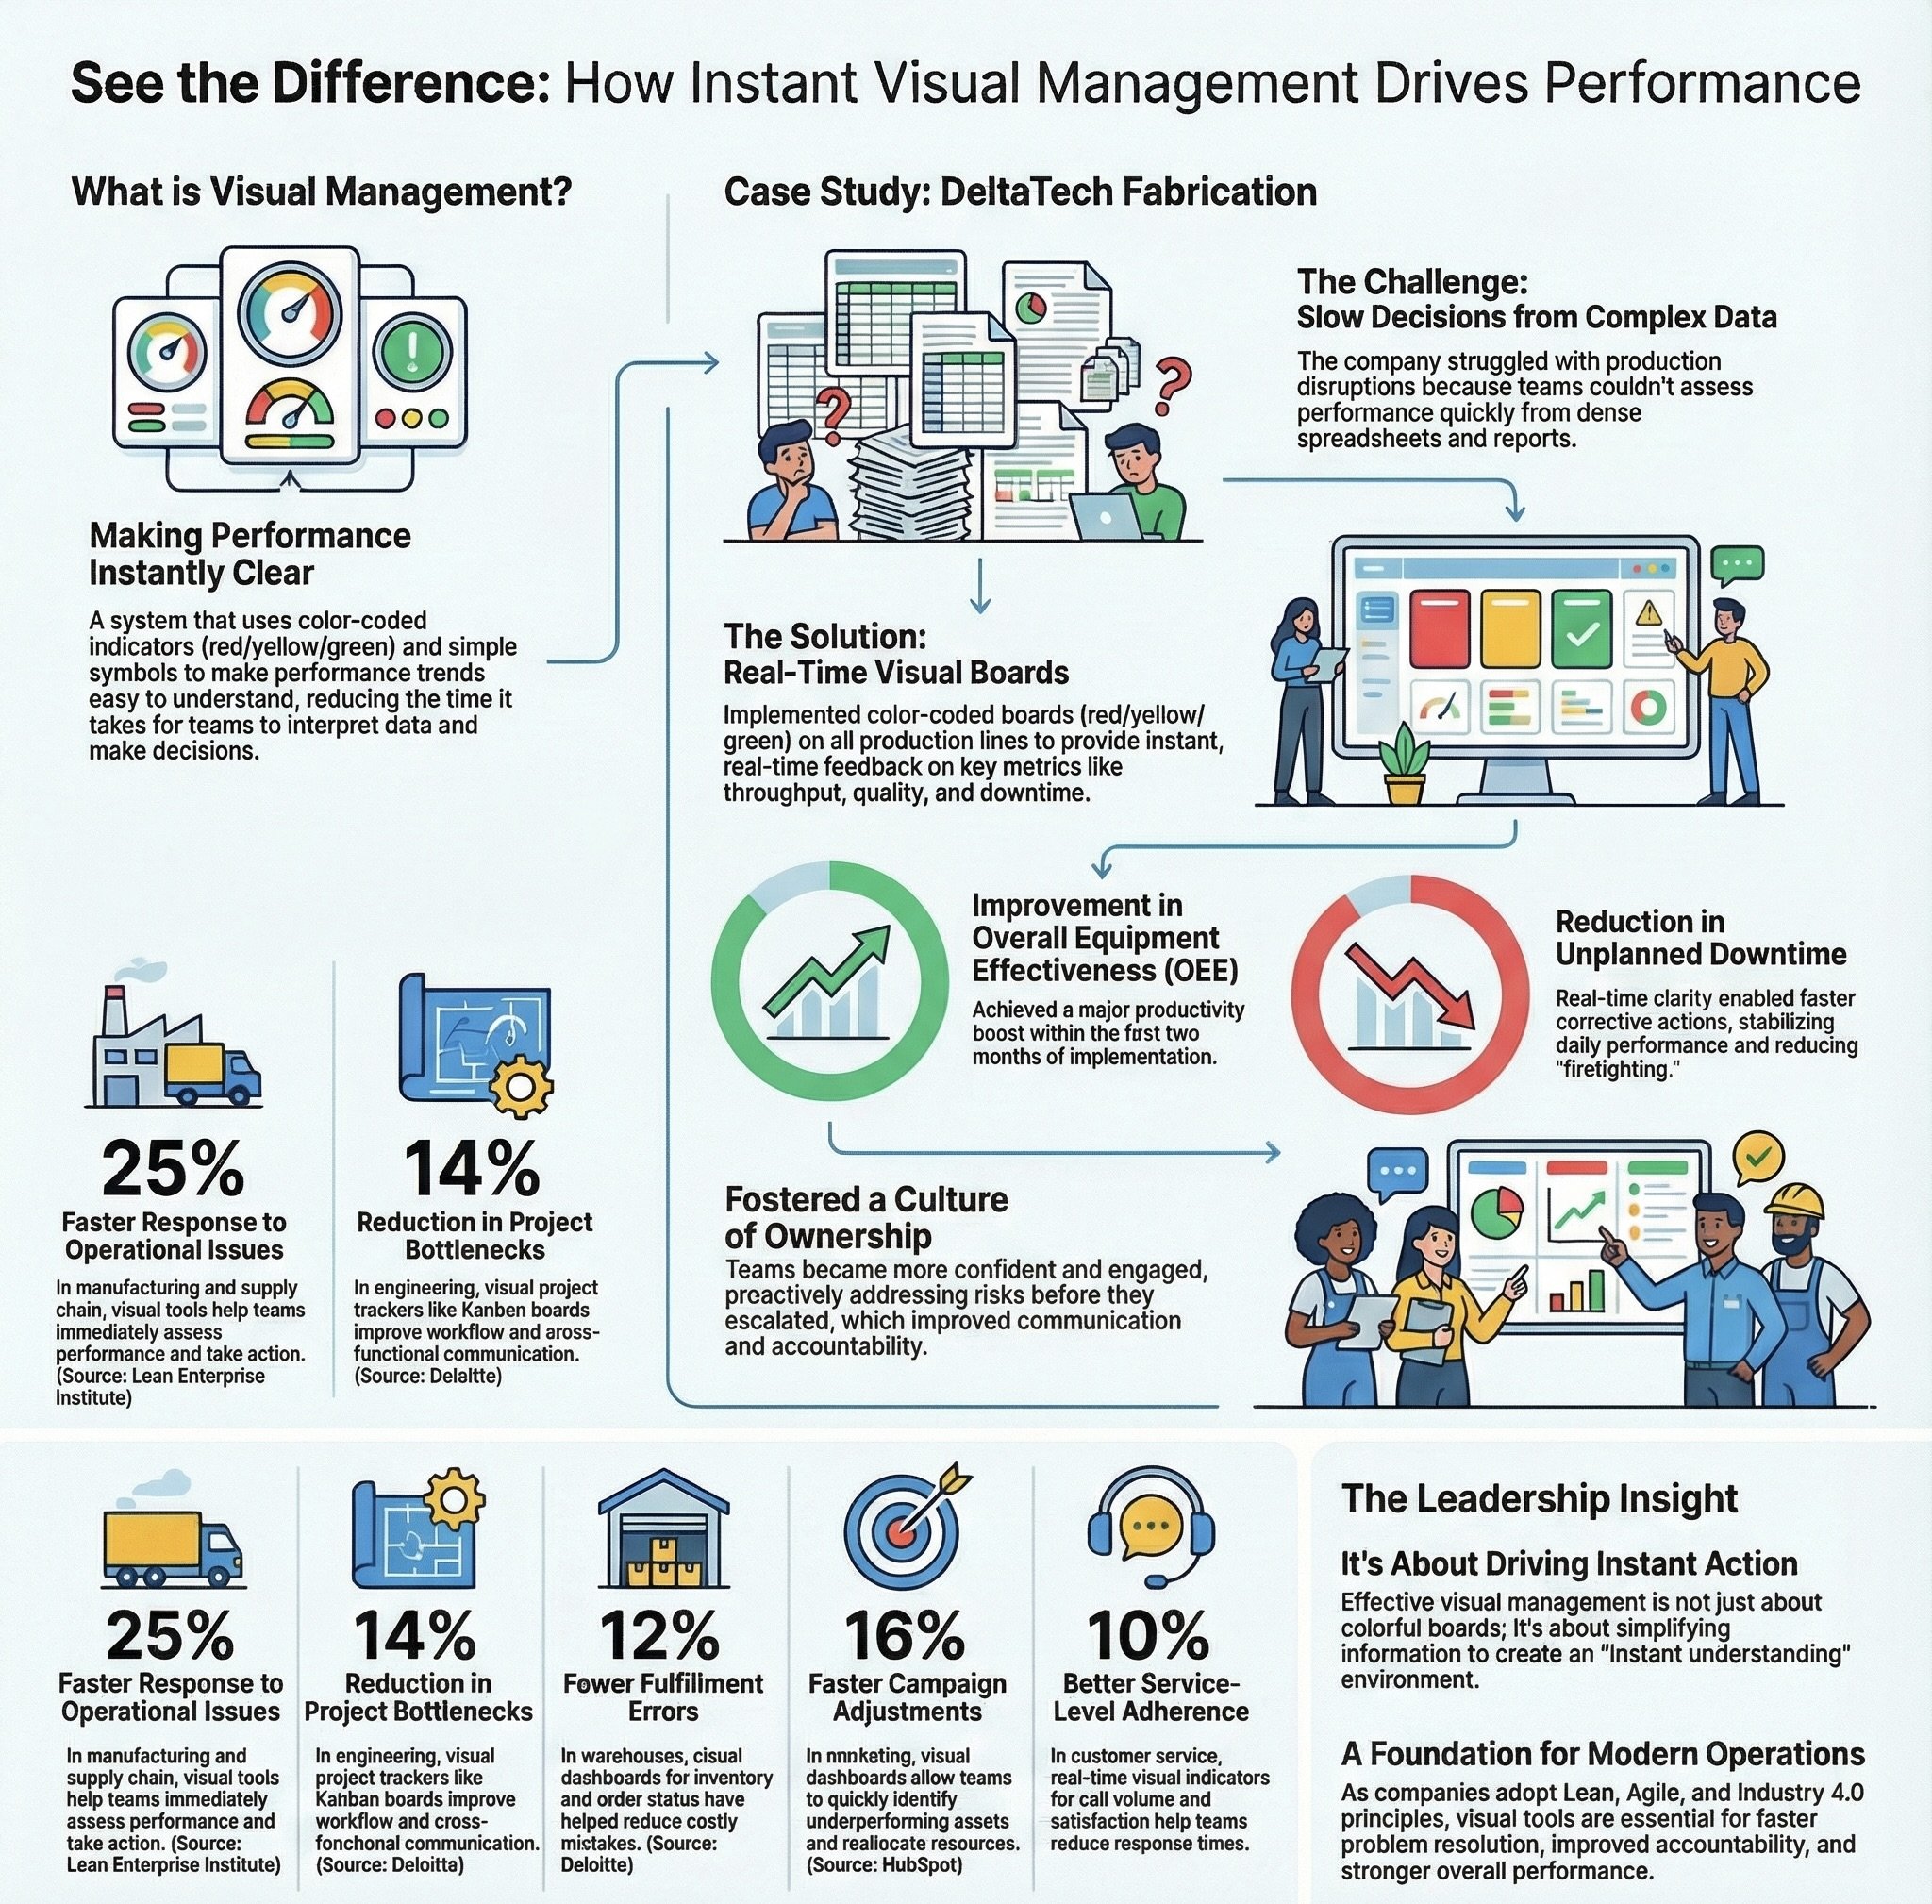
• Marketing: A HubSpot report found that marketing teams using visual campaign dashboards see a 16% faster turnaround on campaign adjustments. The ability to quickly identify underperforming assets allows them to reallocate resources far more effectively.
• Engineering: According to a report from Deloitte, engineering teams using visual project tracking tools like Kanban boards have been able to cut project bottlenecks by 14%, improving cross-functional communication and making progress instantly visible.
• Warehousing & Supply Chain: In logistics control towers and warehouses, visual dashboards monitoring inventory and order status have helped reduce fulfillment errors by up to 12%, ensuring precision in fast-moving environments.
• Customer Service: In service centers, real-time visual indicators for metrics like call volume and satisfaction have helped teams improve their service-level adherence by 10%and reduce response times.
2. The Gains Are Real and Highly Quantifiable.
Implementing visual management isn't just a theoretical improvement; it delivers concrete, data-backed results in a remarkably short time. The case of DeltaTech Fabrication, a manufacturer of industrial components, provides a compelling example.
The company was struggling with slow decision-making caused by overly complex reporting. To solve this, DeltaTech replaced its spreadsheets with simple performance boards on its production lines. Using red, yellow, and green indicators alongside symbols and trend arrows, the boards gave teams an instant understanding of whether they were meeting targets (green), at risk (yellow), underperforming (red), or if performance was improving, declining, or holding steady.
The results were impressive and swift. Within just two months, DeltaTech saw a 13% improvement in overall equipment effectiveness (OEE) and a 16% reduction in unplanned downtime. This aligns with broader industry findings from the Lean Enterprise Institute, which reports that organizations implementing these systems can see up to a 25% reduction in response time to operational issues.
3. It’s About Driving Action, Not Just Displaying Data.
The fundamental purpose of visual management is to shrink the gap between information and action. Traditional reports are lagging indicators; they tell a story about past performance, often requiring significant time to read, interpret, and debate. Visual management, in contrast, creates leading indicators—real-time cues that allow for immediate course correction.
The goal is to create an "instant understanding" environment where the status of a project or process is obvious to everyone at a glance. This represents a strategic shift away from passive data collection and toward active, real-time problem-solving, empowering teams to act on challenges before they escalate.
The true power of visual management lies in closing the gap between seeing a problem and solving it. When performance is instantly clear, teams can act immediately.
4. It Changes Team Culture, Not Just Workflows.
Beyond optimizing processes, one of the most significant impacts of visual management is on people and culture. By making performance transparent and easy to understand, it empowers employees at every level.
At DeltaTech Fabrication, teams reported feeling more confident and engaged after the visual boards were introduced. The clarity provided by the system improved communication and ownership among frontline staff. Instead of waiting for supervisors to interpret a report, operators could see issues for themselves and were empowered to proactively address risks before they escalated.
This transparency dismantles traditional top-down information hierarchies, creating a culture of distributed ownership where problems are solved at the source, not in a manager's meeting. It fosters a more responsive, accountable, and problem-solving operational culture.
Seeing Your Way to Better Work
Visual management is more than just a set of tools; it is a powerful, universal principle for succeeding in a complex world. By prioritizing clarity over complexity, it unlocks speed, sharpens focus, and builds a culture of engagement and accountability. Whether on a factory floor, in an engineering team, or managing a marketing campaign, the lesson is the same: the faster you can see a problem, the faster you can solve it.
Looking at your daily work, what is one complex report that could be replaced by a simple visual cue?